
The topic map · New in Gen 2
See the shape of your data.
Before anyone reads a page, Smartbox reads them all, and draws the case as a map of themes and topics laid out across time.
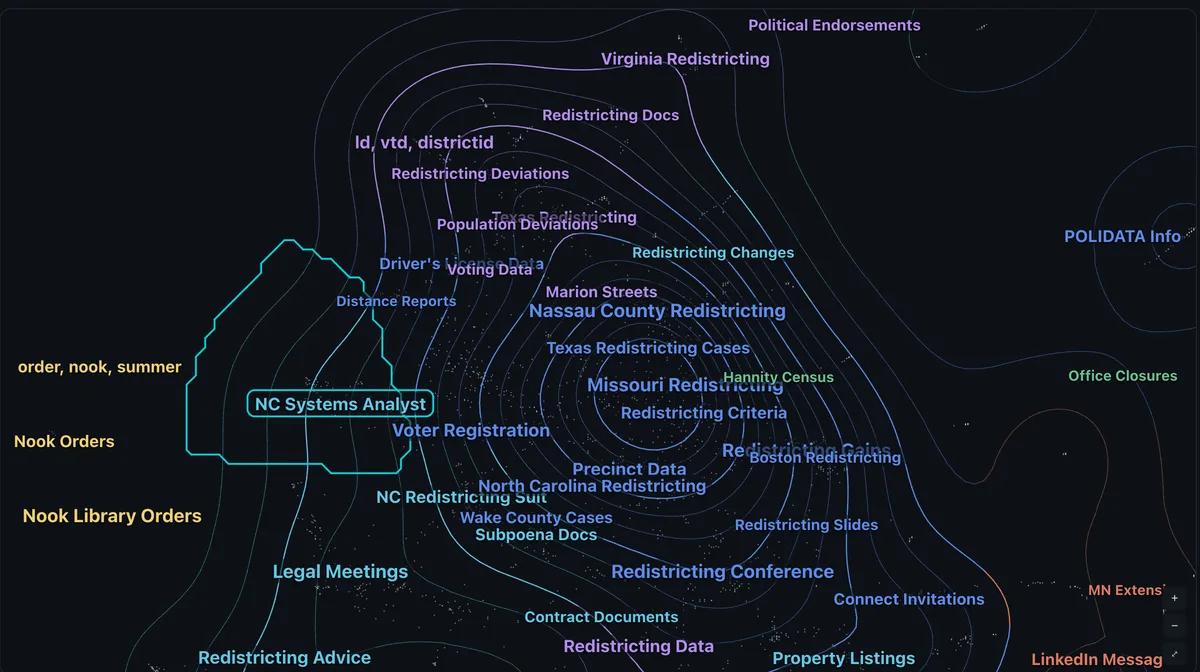
From the whole case to a single thread.
Three levels of detail on one map. Start broad, then narrow down to the documents that matter.
- 01
Themes
The broad subjects running through a case, and how much of it each one covers.
- 02
Topics
The specific matters inside each theme, named and placed beside related topics.
- 03
Detail
One topic’s boundary, its documents and its keywords, ready to open in the workbench.
No keyword lists. No training set. No set-up.
Step 1 · Read
Every document, email and attachment is read, including text inside embedded images.
Step 2 · Group
Unsupervised machine learning groups documents by what they are about. Nobody labels anything first.
Step 3 · Name
Each topic is named and described from its own content, with its keywords listed.
Step 4 · Map
Related topics sit together on the map, and the timeline shows when each was active.
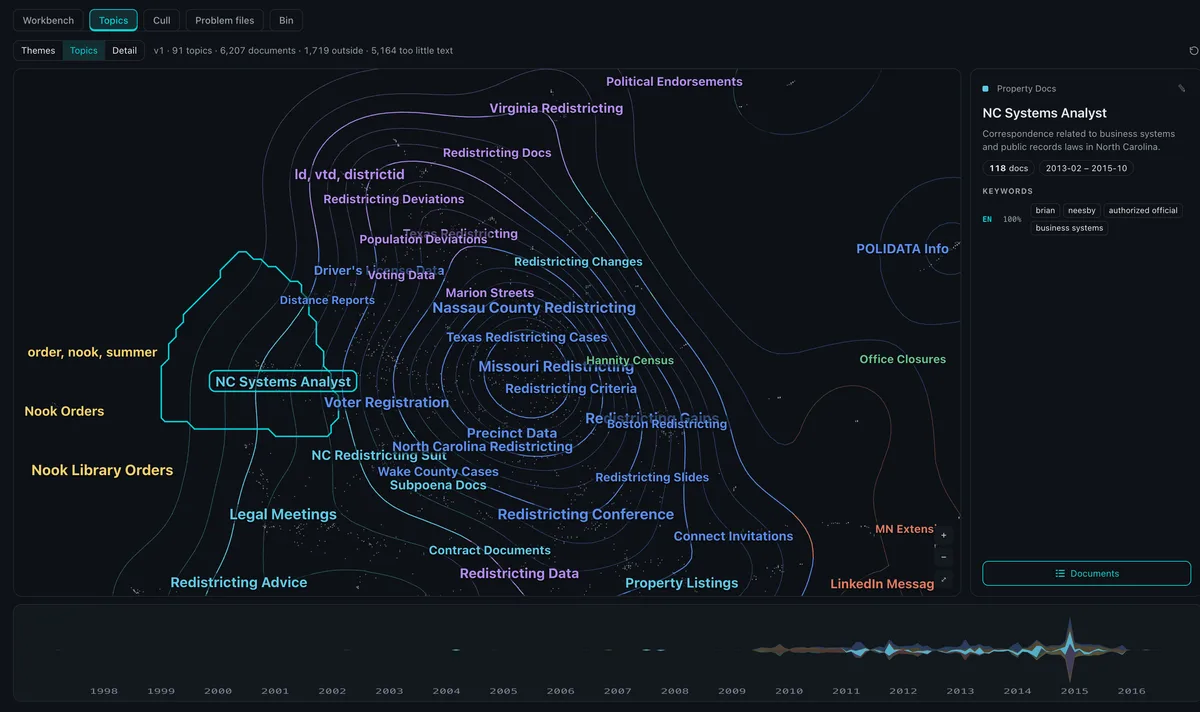
Select a topic
Everything about a topic, one click away.
- Description
- What the topic is about, in a sentence.
- Documents
- How many documents it holds, and a link to open them.
- Date range
- When the topic starts and ends.
- Keywords
- The words that define it, by language.
See your own data on the map.
Every topic, across time.
The timeline under the map shows when each topic was active, so you can see when a conversation started, peaked and went quiet.

One map, every obligation.
Subject access requests
See what a mailbox says about the requester, and what is plainly about something else.
FOI and EIR
Scope a request against what you actually hold, before the clock runs down.
Public inquiries
Get your bearings in a large, unfamiliar collection, and show the inquiry what you hold.
Criminal disclosure
See the material by subject before the schedules are drawn up.
Investigations
Follow a theme across years of email, and see when it began.
Out of scope? Cull the topic.
Take a whole topic out of review in one step, with the decision recorded on the case.
Beta open now · General availability January 2027
Take control of your next case.
Join the Gen 2 beta, or see it working on your kind of material in a 60-minute demo.